The researchers presented an animated map that shows the most powerful sources of gamma radiation.
Pulsing circles represent more than 1,500sources of gamma radiation. In the animation, each frame represents three days of observations. The change in the brightness of the radiation over time is shown by increasing the radius of the circle. The visualization is based on a data set of radio emission sources published in the public domain this month.
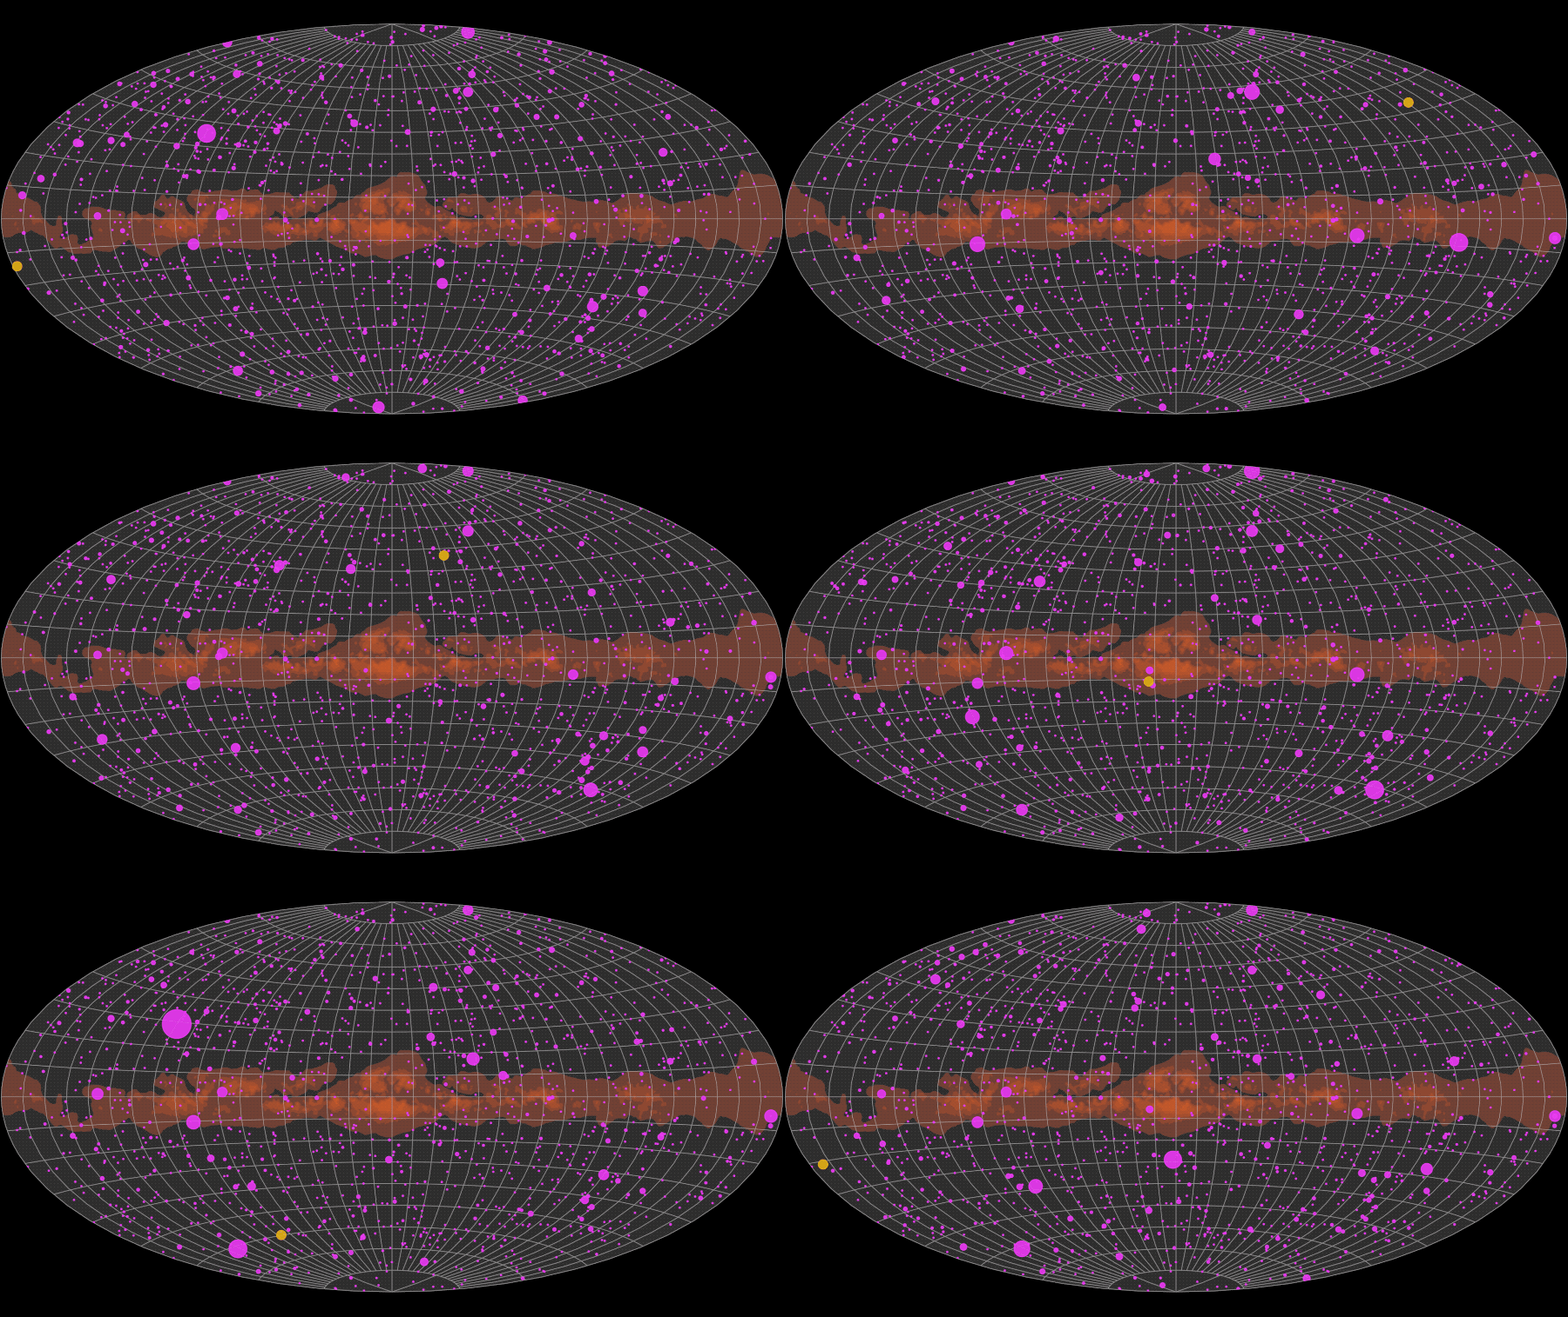 Visualization of observations of the Fermi observatory. The yellow circle shows the movement of the Sun throughout the year. Animation: NASA's Marshall Space Flight Center/Daniel Kocevski
More than 90% of the sources in the dataset areblazars, the central regions of galaxies, in which there are active supermassive black holes, throwing out relativistic jets (jets) in the direction of the Earth. These streams consist of plasma containing high-energy particles.
Telescope LAT, main instrumentThe Fermi Gamma Observatory scans the entire sky every three hours. It detects gamma rays with energies ranging from 20 million to over 300 billion eV (electron volts). For comparison, the energy of visible light is mainly in the range of 2-3 eV.
Observational data from the Fermi Gamma Observatoryare now publicly available in a constantly updated online library. Astrophysicists can use the collected data to study the nature of supermassive black holes located at the centers of distant galaxies.
Read more:
The secret of longevity is revealed: scientists have figured out how to start the necessary mechanism in the human body
Named a new cause of autism
2,700-year-old temple found in Sudan He surprised scientists