According to a new study from the Harvard School of Engineering and Applied Sciences (SEAS), the conservation agency
Research team led byJoannes Masackers, a former SEAS graduate student, has developed a method for tracking and mapping total emissions using satellite data. So far, the data only relate to emissions across the United States, but the researchers plan to calculate emissions for individual states of the country.
Scientists have compared these models to satelliteobservations in 2010-2015. Using a transport model, they were able to trace the path of atmospheric emissions and identify areas throughout the United States where observations and simulations did not match.
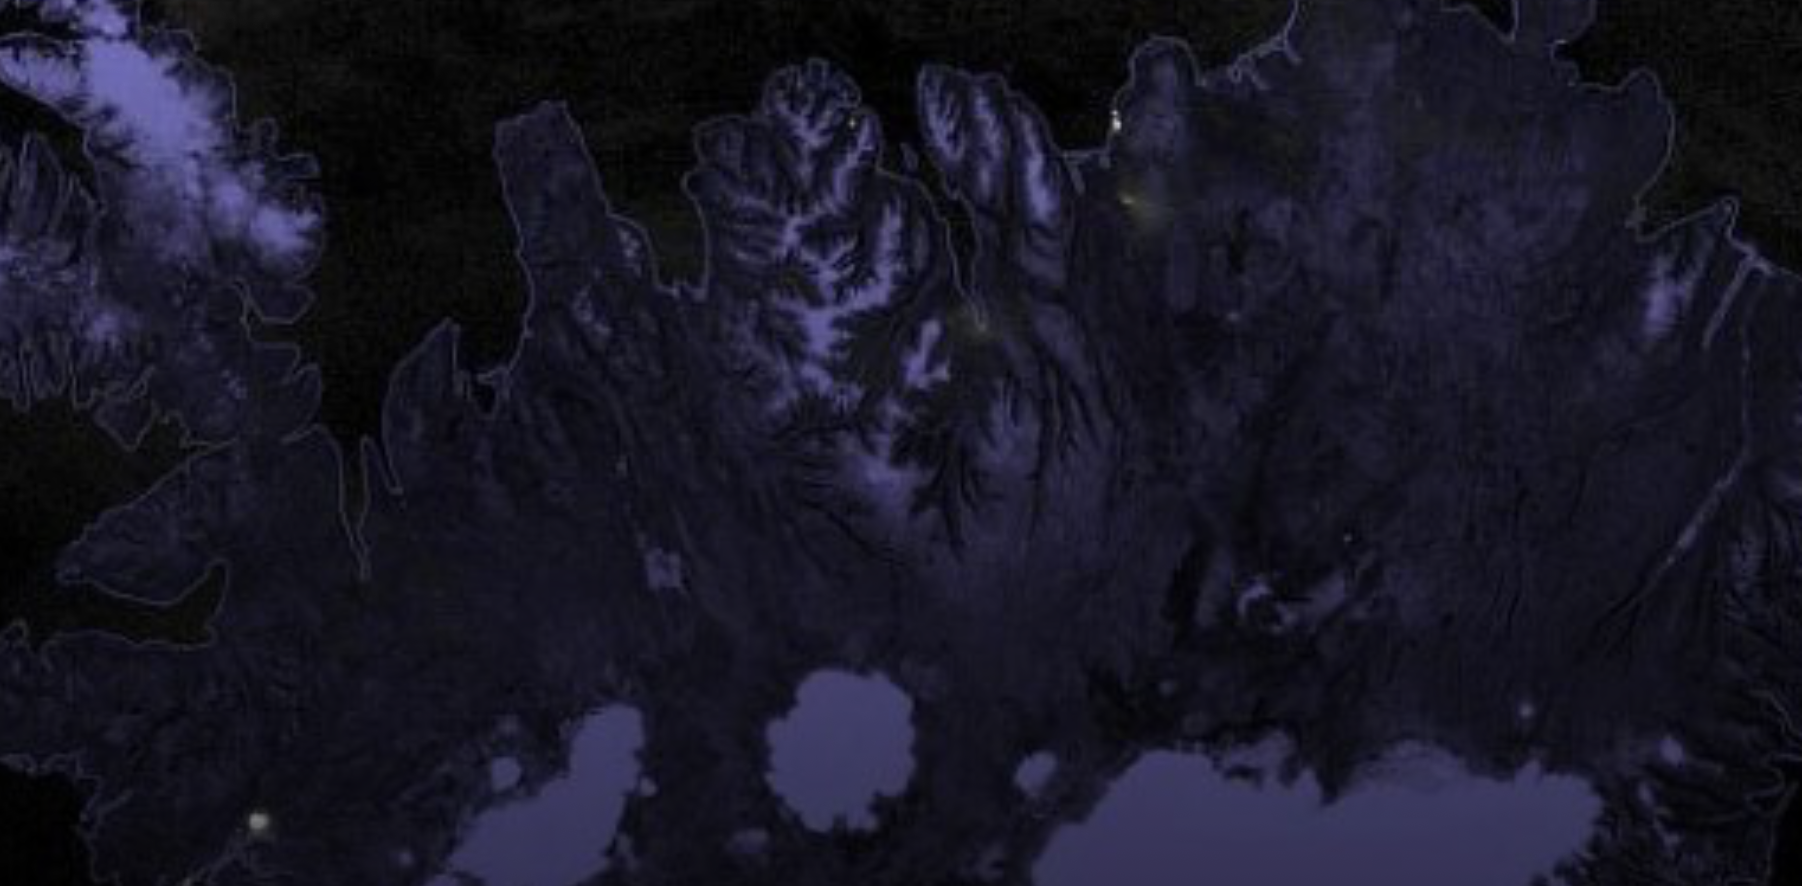
NASA showed what a volcanic eruption in Iceland looks like from space
“When we see emissions from space, we cansee only how the total emissions from a particular area are exaggerated or underestimated, but we do not know the source responsible for these emissions. Since we spent so much time with the EPA figuring out where the various emissions are occurring, we could use our transport model to go back and find out which sources are responsible for these underestimated or overestimated nationally, ”the scientists noted.
They also calculated emissions based on mining processes and equipment. They noticed the largest discrepancy in emissions from oil and natural gas production.
Read more
Ideal conditions for the origin of life found on the moon of Saturn
Oxygen will definitely disappear: what will happen to the Earth without the main source of life
Physicists have created an analogue of a black hole and confirmed Hawking's theory. Where it leads?