Since scientists began measuring Antarctic ice in the late 1970s, it is now at its lowest point.
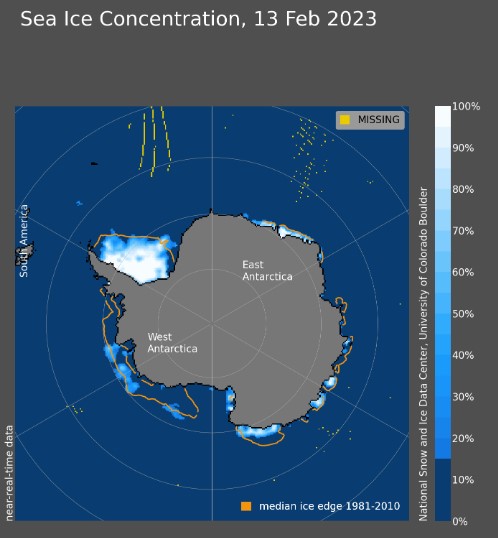 This map of Antarctica shows manyareas of low sea ice concentration, shown in darker blue, surrounding the continent. Its area may decrease in the coming days or weeks. The orange line shows the average ice extent from 1981 to 2010. Credit: NSIDC
Melting sea ice has no direct impactto sea level because it is already in the ocean. However, it surrounds the massive Antarctic ice shelves. Their melting due to climate change threatens catastrophic sea level rise.
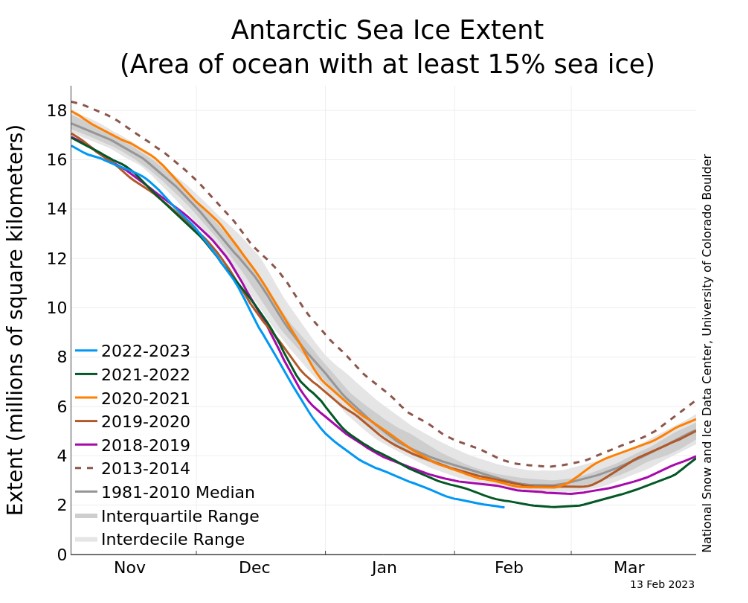 The graph above showsAntarctic sea ice extent as of February 13, 2023, as well as daily ice extent data for the previous four years and the record high year. 2022–2023 is shown in blue, 2021–2022 in green, 2020–2021 in orange, 2019–2020 in brown, 2018–2019 in purple, and 2013–2014 in dotted brown. The median from 1981 to 2010 is highlighted in dark gray. Credit: NSIDC
According to the report, "most of the Antarcticcoasts are ice-free, exposing ice shelves to waves and warmer conditions.” Thus, this week the area of Antarctic sea ice decreased to 1.91 million km². This is a record low compared to 1.92 million km² on February 25, 2022.
Read more:
A powerful flare erupted on the Sun: it has already affected the Earth
Medieval fortress accidentally discovered in the forest: the find surprised scientists
Scientists have found a new genetic disease in children: how it manifests itself