The weather worries people every day: it acts as a daily pain when there is nothing to wear to work,
A short excursion into history
The first steps in weather forecasting were madein ancient Babylon around 650 BC. e. Locals predicted weather changes based on observations of planets, clouds and optical illusions. Only in the 4th century BC. e. Aristotle transformed them into a scientific theory within the framework of the treatise “Meteorology”, in which he spoke about weather phenomena, drought, earthquakes and the connection between precipitation and cold. Then the scientist mistakenly believed that the Sun, stars, comets, rains are phenomena of the same nature, and the Earth is the center of the Universe.
Previously, people relied on weather forecastingsigns. For example, it was believed that the singing of a finch at dawn and the reddish color of the sky indicate the approach of rain. However, according to a Yandex Weather study, only 20% of omens actually come true. Only 75 out of 188 folk predictions turned out to be reliable in more than 50% of cases: often the majority of signs, on the contrary, reflected the opposite picture.
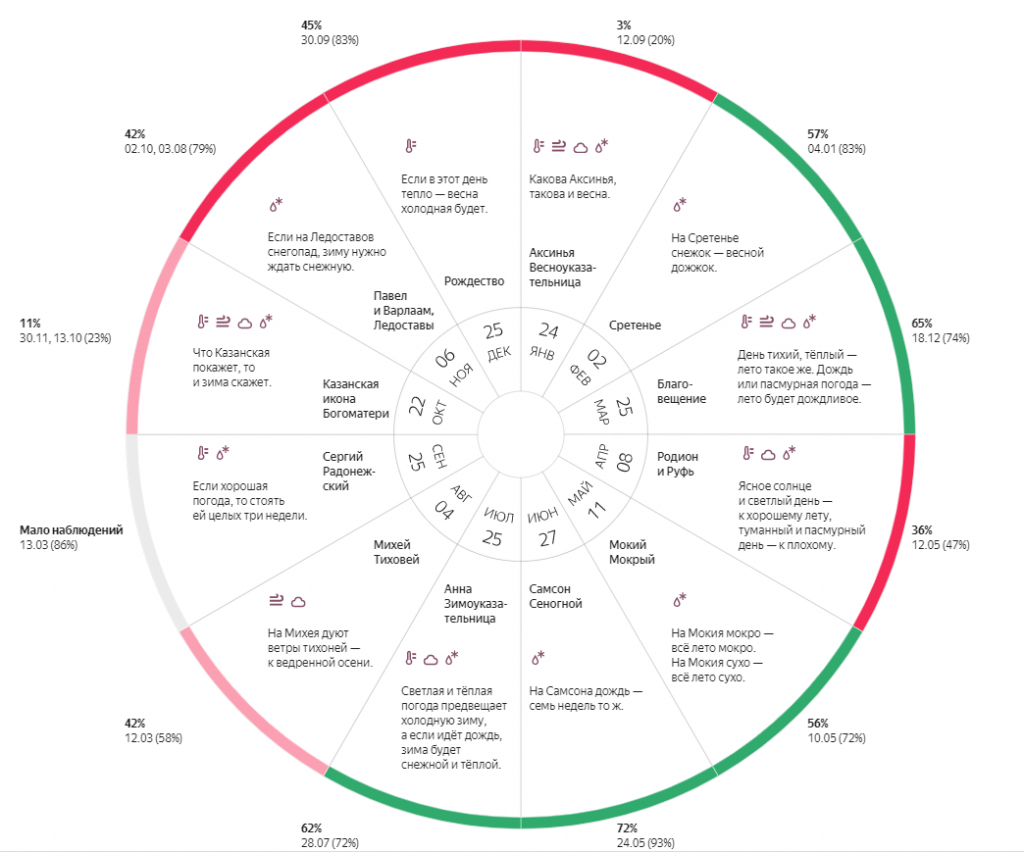 Signs vs. Data
The first official weather forecast was madenaval officer Robert FitzRoy and published in the Times newspaper in 1860. Then the Meteorological Department began work in England, whose forecasts were based on an innovative concept - collecting data using stormglass, monitoring temperature values, wind strength and direction, as well as barometer readings. In the 19th century, American meteorologist Abbe Cleveland developed a mathematical approach to weather prediction called "The Physical Basis of Long-Range Weather Forecasting." His research was later refined by the Norwegian scientist Vilhelm Bjerknes, who created a system that is still used today. He was responsible for the discovery of atmospheric fronts, which in the future made it possible to create a theory of the occurrence and changes of cyclones, as well as synoptic maps.
Russia has begun to systematically collect weather dataeven under Peter I, and already in 1724 the first weather station opened. Then, at the Academy of Sciences, observations of weather variability were carried out using a barometer and thermometer. Later, in 1856, telegraph data collection was organized, but the official date for the start of the specialized service and the publication of special bulletins was January 13, 1872. By the middle of the 19th century, there were 50 meteorological stations in the country, and by the beginning of the 20th century it had become the widest network in the world.
Data collection assistants
At the beginning of the 20th century they became in demandmeteorological stations. Today, the leader in their number is China - there are about 15,000 stations there. There are only 4,500 of them in Russia, and most of them are not equipped with remote monitoring and control.
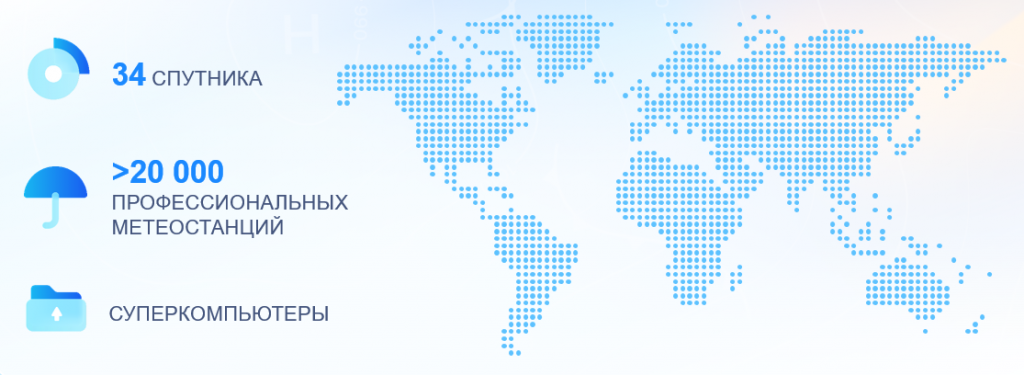 How the weather is determined
There are three types of weather stations:
— automatic professional (autonomously send data to weather centers);
— weather buoys (collect information about the temperature of the water and the atmosphere on its surface);
- semi-automatic professional (imply the presence of a meteorologist who controls the work and troubleshoots the equipment).
In addition, every day at 12 noon and noonUTC, meteorologists launch weather balloons into the sky - balloons filled with helium or hydrogen that can rise to a height of 35 km above the ground (twice as high as airplanes). Having reached the designated point, the radiosonde transmits data on the critical temperature, atmospheric pressure, humidity and wind in the upper layer of the atmosphere. Without this, it is impossible to make forecasts several hours in advance.
To track cloud formations, zonesintense precipitation and hazardous phenomena (thunderstorm, hurricane, hail), weather radars based on the Doppler effect are used. The frequency of the signal reflected from moving objects varies depending on the speed of their movement. So, by comparing the transmitted and received impulse, you can find out in which area the accumulation of precipitation is located.
There are several types of weather radars:
— radar for detecting precipitation operates in the S- and C-bands or in the X-band at short distances;
— radar for detecting clouds (K- or W-band);
— MST operates at low frequencies to measure the height of the boundaries of air layers having different densities;
- aviation weather radar is used in the X-band as a navigator for collision avoidance;
- Doppler weather radarallows you to simultaneously transmit and receive horizontally and vertically polarized waves, as well as carry out periodic observation (from 3 to 15 minutes) within a viewing radius of 250–300 km. We see graphic information obtained from DMRL-S on many weather sites.
In addition, to monitor and transmit data aboutMeteorological satellites are used to measure the temperature of the Earth's surface and cloud, snow and ice cover: geostationary and polar. The first rise to a height of 36 thousand km above sea level in the direction of the Earth's rotation and develop a speed equal to the speed of the planet's rotation. They cover 42% of the hemisphere and continuously show the situation in large regions. Polar satellites move in lower orbits of 850 to 1,000 km and provide views of the area at six-hour intervals.
Each weather satellite is equipped with two types of instruments.Surveys provide television and photographic images of land and ocean surfaces, as well as cloud, snow and ice cover. Measuring instruments collect quantitative characteristics about the state of the atmosphere, hydrosphere and magnetosphere.
Modern forecasting methodology
English scientist Lewis Richardson in 1910proposed a method for solving Bjerknes differential equations using numerical methods. Due to the high complexity of calculations and the lack of machine power, his idea received recognition only after several years.
Mathematician John von Neumann launched the projectElectronic Computer Project for the development and further production of devices capable of solving complex mathematical problems. The first ENIAC (Electronic Numerical Integrator and Compute) machine was launched in 1946. By modern standards, its computing power was negligible (357 multiplication operations or 5,000 addition operations per second), which was very different from its external data. The machine consisted of thousands of vacuum tubes and hundreds of thousands of resistors, capacitors and inductors and weighed more than 30 tons. Already in 1950, with the help of ENIAC, the first mathematical weather forecast was made using the Lewis Richardson formula. But the problem was that the car couldn’t keep up with the changing weather: to get a forecast for the next 24 hours, it took exactly the same amount.
Almost 30 years after the production of the firstcomputer Seymour Cray, founder of Cray Research, created the first supercomputer - Cray-1. Unlike ENIAC, Cray-1 was capable of performing up to 180 million operations per second, which significantly reduced latency. And today Cray Inc. remains one of the main manufacturers of supercomputers in the world.
Russia's main supercomputer, which simulatesweather, located at the Hydrometeorological Center. Its performance is rated at 1.2 PFLOPS. The tool consists of 976 computing nodes, each of which has two Intel Xeon E5-2697 version 4 server processors and 128 GB of RAM.
 Supercomputer
How popular services collect data
The most popular services in Russia are Yandex Weather and Gismeteo.
Gismeteo collects weather data through the World Wide Webmeteorological organization, radars, satellites, weather stations. After complete processing in mathematical models, the forecaster adjusts the finished forecast and puts it on the users’ map.
Yandex uses its own development “Meteum”,based on four foreign forecasts and one of our own, which is made using the WRF (Weather Research and Forecasting) model. This system is designed for both atmospheric research and operational forecasting. Additionally, the service uses Nowcasting technology, which allows you to make a short-term forecast (from 2 to 6 hours). As a result, a detailed weather forecast is graphically reflected on the precipitation map.
Why forecasts are wrong
The first reason for inaccurate predictions is errors inweather data When the supercomputer finishes its model calculations, a deterministic weather forecast for some period of time becomes known. The “butterfly effect” can work here: if there was a microscopic error in the initial data, over the course of a few days it will turn into a huge inaccuracy. To combat this problem, you can use ensemble forecasts, that is, insert artificial errors into the model using number generators. For example, if a weather station recorded a temperature of +10 degrees, you can load a value slightly lower into the model. As a result of repeated calculations, a weather graph is formed: if one forecast indicates warming, and all the others indicate cooling, such data will be erroneous.
There is also a multi-model method that uses the average of multiple model forecasts to determine future weather conditions.
Another challenge is the lack of weather data.There are only 4,500 weather stations in Russia (1.5 times less than recommended by the World Meteorological Organization). The optimal distance between points is 50 km in flat terrain and 25 km in the mountains. Under normal circumstances, at least 7,000 weather stations should be installed in Russia. This problem is somewhat alleviated by data coming from ordinary users through surveys or home weather stations, as well as open information from other weather centers.
The third reason is the spontaneity of the weather.It is almost impossible to take into account all the nuances. The longer the forecast, the more errors it contains. Therefore, people are advised to monitor weather changes daily. For example, a forecast for 12 o'clock will be correct with a probability of 95%. At the same time, long-term forecasts formed several days in advance will turn out to be correct with a probability of 65%.
A little about weather marketing, or what does burgers have to do with it?!
The weather sets the mood.According to a study by the Joys.Loyalty platform, about 84% of people make impulse purchases. Marketers try to identify patterns using Big Data tools that look for correlations between revenue and weather conditions.
For example, the largest retail chain Walmartdetermined that the wind affects the sale of berries. The company launched an advertising campaign in regions with a similar climate - thus, the brand increased sales three times. In addition, marketers have noticed that minced meat sells well in warm, sunny weather when there is little wind outside. This research helped increase burger sales by 18%.
 How weather affects sales
American TV channel The Weather Channeltracks the influence of weather on the emotional background of television viewers. His collaboration with the Pantene brand helped increase product sales by 10% in two months. Together with the Walgreens pharmacy chain, the company decided to advertise a product for curly hair during periods of high air humidity. This impacted the entire hair care market, with total sales in the segment increasing by 4%.
By comparing weather data and flight schedules,The Red Roof hotel chain targeted a marketing campaign to those regions where flights are often canceled or rescheduled due to weather conditions. By offering passengers accommodation in hotels near airports, the company increased profits by 10%.
Today technology is capable of many things, includingincluding adapting to weather conditions in a particular region. For example, Spotify has released a song by the band White Denim, which users can listen to only when it’s raining.
Read more:
17-year-old engineer came up with a magnetless motor: it can be used in electric vehicles
Two planets have been found not far from Earth. Perhaps they are inhabited
A unique meteor rewrote the history of the solar system: where did it come from